Jennifer, the VP of Sales at a software company, proudly announced at the Monday meeting: “Great news! Our team made 500 calls last week, sent 1,000 emails, and held 75 meetings.” The CEO paused and asked, “That’s a lot of activity, but how many deals did we close? What’s our win rate, and are we on track to hit our revenue targets?”
Jennifer realized she had been measuring sales activity, not sales results. After implementing proper sales KPI tracking, the reality was revealing: despite all that activity, their win rate was only 12% (industry average was 27%), average deal size had dropped 35%, and sales cycle length had stretched from 45 to 78 days. Only 15% of their pipeline was actually qualified. However, this clarity enabled focused action. Six months later, by tracking the right KPI sales metrics, they improved win rates to 31%, increased average deal size by 48%, shortened sales cycles to 52 days, and improved pipeline quality dramatically, resulting in 142% revenue growth.
This comprehensive guide explores what is KPI in sales, provides essential frameworks for sales KPI measurement, and shows you how to build a sales KPI dashboard that drives predictable revenue growth instead of just tracking busy work.
What Is KPI in Sales?
What is KPI in sales exactly? A sales Key Performance Indicator is a quantifiable measurement that evaluates how effectively your sales team achieves specific revenue and growth objectives. Understanding what does KPI stand for in sales is crucial: KPI means Key Performance Indicator, the critical metrics that actually predict and drive sales success.
KPI meaning in sales goes beyond simple activity tracking. While activities like calls made or emails sent might be monitored, true sales KPIs focus on outcomes that directly impact revenue, growth, and profitability.
The distinction matters:
- Sales Activities: Calls made, emails sent, meetings held
- Sales KPIs: Win rate, average deal size, sales cycle length, quota attainment
Sales KPIs serve several critical functions:
- Predict future revenue with greater accuracy
- Identify which activities actually drive deals
- Enable data-driven coaching and improvement
- Demonstrate sales team contribution to business growth
- Guide strategic decisions about territories, compensation, and resources
Understanding KPI in Sales vs. Activity Metrics
Before diving into specific metrics, it’s essential to understand KPI for sales versus what’s merely activity data. Many sales organizations make the mistake of tracking activity metrics, numbers that show effort but don’t correlate with results.
Activity Metrics Examples:
- Total calls or emails sent (without response or conversion context)
- Number of meetings held (without qualification or progression)
- LinkedIn connections made
- Proposals sent (without close rate tracking)
True Sales KPIs:
- Win rate and loss analysis
- Average deal size and revenue per customer
- Sales cycle length
- Pipeline coverage ratio
- Quota attainment percentage
The key difference? KPI in sales directly connects to revenue outcomes and financial performance. If increasing a metric doesn’t reliably increase revenue, it’s probably an activity indicator rather than a true KPI.
Comparison: Activity Metrics vs. Sales KPIs
Sales Call Volume
- ❌ Activity Metric: Total calls made per day – High volume means nothing if calls don’t convert
- ✅ Sales KPI: Conversion rate from call to qualified opportunity – Shows which calls actually generate pipeline
Meeting Activity
- ❌ Activity Metric: Number of meetings scheduled – Meetings with unqualified prospects waste time
- ✅ Sales KPI: Meeting-to-opportunity conversion rate – Reveals meeting effectiveness and qualification accuracy
Email Outreach
- ❌ Activity Metric: Emails sent per week – Volume without response is noise
- ✅ Sales KPI: Email response rate and meeting booking rate – Measures message effectiveness and targeting quality
Proposal Creation
- ❌ Activity Metric: Proposals delivered – Sending proposals to unqualified prospects inflates numbers
- ✅ Sales KPI: Proposal-to-close conversion rate – Shows deal quality and sales execution effectiveness
The fundamental principle: sales KPI metrics must predict or directly measure revenue generation. Activity metrics provide supporting data, but KPIs drive strategy and compensation decisions.
Core Sales KPI Categories
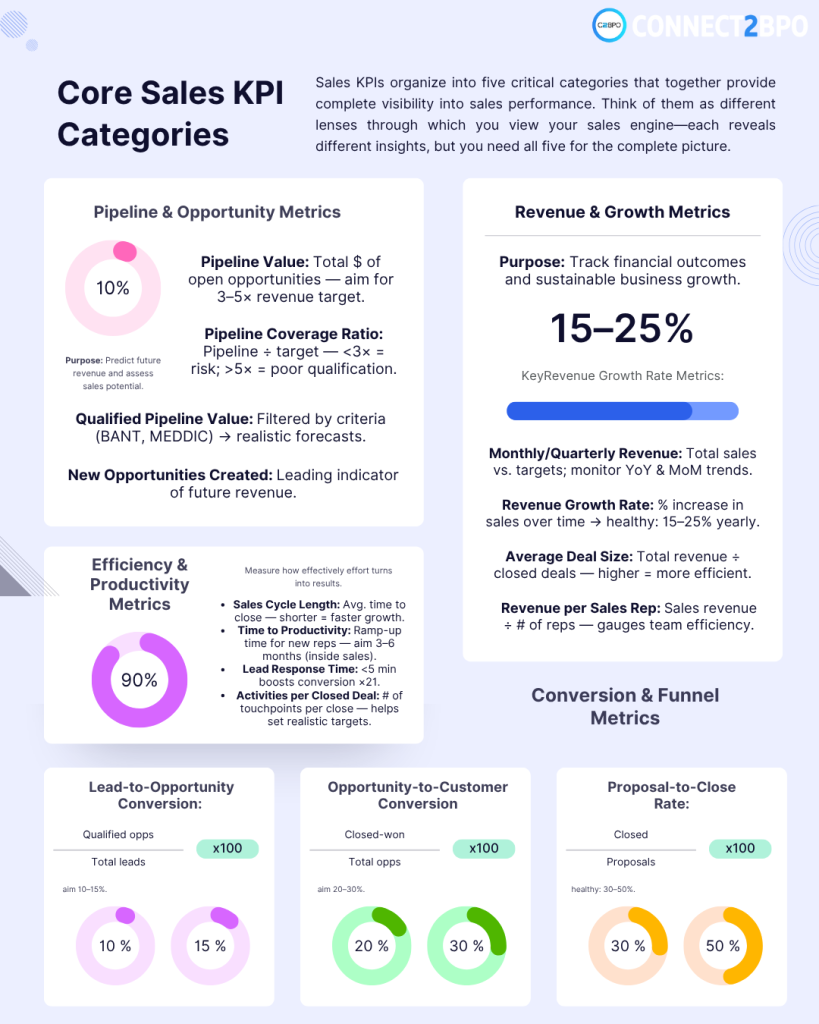
Sales KPIs organize into five critical categories that together provide complete visibility into sales performance. Think of them as different lenses through which you view your sales engine—each reveals different insights, but you need all five for the complete picture.
- Revenue and Growth Metrics
Measuring the ultimate outcomes: money in the bank
These metrics answer the most fundamental question: “Are we making money?” Revenue KPIs show not just whether you’re hitting targets, but whether your business is growing sustainably and profitably.
- Monthly/Quarterly Revenue tracks total sales in a specific period. This is your scoreboard—the primary measure everyone from the CEO to individual reps watches closely. Compare actual performance against targets to identify gaps early. Look at year-over-year growth to see if you’re gaining momentum or losing ground. Month-over-month trends reveal seasonality patterns and help predict future performance.
- Revenue Growth Rate shows the percentage increase in sales revenue over time. Calculate it by taking current period revenue minus previous period revenue, divided by previous period revenue, then multiply by 100. Healthy growth-stage companies typically target 15-25% annual growth, though this varies dramatically by industry and company maturity. Declining growth rates signal market saturation, increased competition, or execution issues.
- Average Deal Size measures the mean value of your closed deals. Calculate it by dividing total revenue by the number of closed deals. This metric is powerful because increasing deal size improves revenue without requiring more deals—making your sales team more efficient. If average deal size is declining, you’re either pursuing smaller customers, discounting too heavily, or facing pressure to unbundle your offerings.
- Revenue per Sales Rep shows average revenue generated by each salesperson. Divide total sales revenue by number of sales reps. This efficiency metric reveals whether you’re getting adequate return on your sales investment. Low revenue per rep suggests poor targeting, insufficient training, or misaligned territories. Industry benchmarks vary widely—inside sales reps might generate $500K-$1M annually while enterprise reps might produce $2M-$5M+.
- Pipeline and Opportunity Metrics
Your future revenue: what’s coming down the line
Pipeline metrics are your crystal ball. They predict future revenue months in advance, giving you time to course-correct before problems become crises. A healthy pipeline today means hitting targets next quarter.
- Pipeline Value is the total dollar value of all open opportunities across all stages. This single number tells you how much potential revenue you’re working on. Your pipeline should typically be 3-5 times your revenue target—this coverage ratio accounts for deals that will inevitably be lost or pushed to future periods.
- Pipeline Coverage Ratio compares your pipeline value to your revenue target. Calculate it by dividing total pipeline value by revenue target. If your coverage drops below 3×, you don’t have enough pipeline to hit your numbers even with a strong win rate. Coverage above 5× might indicate inflated pipeline or poor qualification—you’re tracking deals that aren’t real opportunities.
- Qualified Pipeline Value measures pipeline of properly qualified opportunities only. This removes the fantasy from your forecast. Use consistent qualification criteria like BANT (Budget, Authority, Need, Timeline) or MEDDIC (Metrics, Economic Buyer, Decision Criteria, Decision Process, Identify Pain, Champion). Qualified pipeline provides far more accurate revenue predictions than total pipeline.
- New Opportunities Created counts qualified opportunities added to your pipeline in a given period. This leading indicator predicts revenue 1-3 quarters ahead depending on your sales cycle length. Declining opportunity creation means future revenue problems—you’re catching the issue before it hits your numbers.
- Opportunity Win Rate shows what percentage of qualified opportunities close successfully. Calculate by dividing won opportunities by total closed opportunities (won plus lost), then multiply by 100. Target 20-30% for most B2B sales, though this varies significantly by industry and deal complexity. Win rates below 20% suggest poor qualification—you’re chasing too many bad deals. Win rates above 40% might mean you’re too conservative and missing opportunities.
- Efficiency and Productivity Metrics
How effectively your team converts effort into results
Efficiency metrics reveal whether your sales process is a well-oiled machine or a rusty jalopy. These KPIs show where time and effort get wasted, and where your team performs exceptionally.
- Sales Cycle Length measures average time from first contact to closed deal. Calculate by summing all deal cycle times and dividing by the number of closed deals. Shorter cycles mean faster revenue recognition and more deals closed per rep over time. If your cycle lengthens, investigate whether deals are getting stuck in specific stages, whether you’re pursuing more complex opportunities, or whether competitive pressure has increased.
- Time to Productivity (new rep ramp time) tracks how long it takes new sales reps to reach full productivity—typically measured as time from hire to first hitting quota. Inside sales reps often ramp in 3-6 months, while enterprise sales can take 6-12 months. Long ramp times drain profitability as you pay salaries and overhead for months before seeing returns. Reducing ramp time through better onboarding, training, and coaching directly improves sales ROI.
- Lead Response Time measures how quickly reps respond to new leads. Research shows responding within 5 minutes versus 30 minutes increases conversion by 21 times. Target under 5 minutes for hot leads and within 24 hours for standard leads. Slow response kills conversion because prospects contact multiple vendors simultaneously—if you’re slow, competitors get there first.
- Activities per Closed Deal shows the average number of touchpoints required to close deals. Track calls, emails, meetings, and demos from first contact to close. This metric helps set realistic activity targets based on what actually works rather than arbitrary numbers. If top performers close deals with 15 touchpoints while others need 30, coaching opportunities are clear.
- Conversion and Funnel Metrics
Where prospects drop off and where they advance
Conversion metrics reveal the health of your sales funnel at each stage. They show exactly where you’re strong and where deals die, enabling targeted improvements.
- Lead-to-Opportunity Conversion Rate measures what percentage of leads become qualified sales opportunities. Calculate by dividing qualified opportunities by total leads, then multiply by 100. Target 10-15% for most B2B organizations. Low conversion rates indicate poor lead quality from marketing, weak qualification criteria, or inadequate follow-up by sales.
- Opportunity-to-Customer Conversion Rate shows what percentage of qualified opportunities become customers. Divide closed won deals by total opportunities and multiply by 100. Healthy pipelines convert 20-30% of qualified opportunities. This metric differs from win rate because it includes opportunities still open—win rate only considers closed deals.
- Demo/Presentation-to-Close Rate tracks what percentage of product demonstrations result in closed deals. Low rates suggest either poor qualification before the demo (you’re demoing to people who won’t buy) or ineffective demonstration skills (you can’t communicate value). High performers might convert 40-50% of demos while struggling reps convert only 10-15%.
- Proposal-to-Close Rate measures what percentage of proposals convert to closed deals. Calculate by dividing closed won deals by proposals sent, then multiply by 100. Target 30-50% for well-qualified pipelines. Below 20% indicates poor targeting—you’re sending proposals to prospects who aren’t serious buyers. This wastes time creating proposals and negotiating deals that will never close.
- Performance and Quota Metrics
Individual and team achievement against targets
Quota metrics measure performance against expectations. They drive compensation, reveal top performers, and identify who needs coaching or performance management.
- Quota Attainment Rate shows what percentage of your sales team is meeting or exceeding targets. Calculate by dividing reps meeting quota by total reps, then multiply by 100. Healthy sales organizations see 60-70% of reps hitting quota. If everyone hits quota easily, targets are too low and you’re leaving money on the table. If almost no one hits quota, targets are unrealistic and you’ll face retention problems.
- Individual Quota Attainment tracks each rep’s performance against their individual target. Calculate by dividing actual revenue by quota, then multiply by 100. This directly drives commission calculations and bonus eligibility. Track this monthly and quarterly to identify performance trends early. Reps at 50% of quota at mid-quarter need immediate intervention.
- Percentage of Reps Above 100% of Quota reveals what portion of your team exceeds targets. This metric signals whether your quota-setting process is calibrated correctly. If 90% exceed quota, targets are too easy. If only 10% exceed quota, they’re too aggressive. The sweet spot is typically 30-40% of reps exceeding quota, showing targets are challenging but achievable for high performers.
Sample Sales KPI by Role and Level
Individual Sales Rep KPIs
- Sample sales KPI metrics for individual contributors focus on personal performance and pipeline management:
- Personal Quota Attainment: Percentage of individual revenue target achieved. Top performers consistently achieve 100-120%+ of quota.
- Number of Closed Deals: Total deals closed per month or quarter, tracking consistency and pipeline conversion.
- Average Deal Size: Mean value of rep’s closed deals, revealing whether they pursue high-value opportunities or focus on volume.
- Win Rate: Individual conversion rate from opportunity to closed-won, typically 20-35% for effective reps.
- Pipeline Generation: Value and number of new qualified opportunities created through prospecting and relationship building.
- Activity Ratios: Calls-to-meetings ratio, meetings-to-opportunities ratio, showing efficiency of sales activities.
Sales Manager KPIs
Sales managers track both team performance and individual development:
- Team Quota Attainment: Aggregate performance of all reps against team targets. Strong managers achieve 90-100%+ of team quota.
- Team Win Rate: Overall conversion rates across the entire team, identifying coaching opportunities.
- Pipeline Health: Monitoring pipeline coverage, velocity, and quality across all reps to ensure predictable revenue.
- Rep Ramp Time: How quickly new team members reach productivity, reflecting onboarding and coaching effectiveness.
- Rep Turnover Rate: Percentage of reps leaving the team, impacting team stability and revenue predictability.
- Forecast Accuracy: How closely manager’s forecasts match actual results, critical for business planning.
Sales Leadership KPIs
VPs of Sales and Chief Revenue Officers focus on strategic and financial metrics:
- Revenue Growth Rate: Year-over-year and quarter-over-quarter growth rates, the ultimate measure of sales leadership effectiveness.
- Customer Acquisition Cost (CAC): Total cost of sales and marketing to acquire one customer, balancing growth with efficiency.
- Sales Efficiency Ratio: Revenue generated per dollar of sales expense, measuring team productivity and cost-effectiveness.
- Market Share Growth: Competitive positioning and share of total addressable market.
- Customer Lifetime Value (CLV): Total revenue per customer over their lifetime, ensuring focus on high-value, long-term customers.
- Sales Team Capacity: Total achievable revenue based on rep count, quotas, and expected attainment rates.
Sales KPI Format and Structure
Sales KPI format refers to how KPIs are organized, calculated, and presented. Proper formatting ensures consistency, accuracy, and usability across the organization.
Standard KPI Format Components
KPI Name: Clear, descriptive title that’s universally understood across the organization.
Definition: Precise explanation of what the KPI measures and why it matters.
Formula: Exact calculation method with all components defined. Example: Win Rate = (Closed Won Opportunities ÷ (Closed Won + Closed Lost Opportunities)) × 100
Data Sources: Specific systems and fields where data originates (e.g., Salesforce Opportunity Stage field, Close Date, Amount).
Update Frequency: How often the KPI is calculated and reported (daily, weekly, monthly, quarterly).
Target/Benchmark: Goal performance level and industry/historical benchmarks for context.
Owner: Individual or role responsible for monitoring and acting on the KPI.
Trend Direction: Whether increases or decreases in the metric are positive (↑ good, ↓ good, or ↔ target range).
Creating KPI Documentation
Documenting your sales KPI format in a central repository ensures consistency:
KPI Dictionary: Comprehensive document defining each KPI with all components above. Prevents confusion from different calculation methods or interpretations.
Calculation Examples: Step-by-step examples showing how to calculate each KPI with sample data, reducing errors and increasing confidence.
Change Log: Historical record of KPI definition changes, maintaining continuity in trend analysis.
Building Your Sales KPI Dashboard
A well-designed sales KPI dashboard provides immediate visibility into sales performance while enabling deeper analysis. Effective dashboards balance simplicity with completeness.
Dashboard Design by Audience
Executive Sales Dashboard (5-8 metrics):
- Total revenue (actual vs. target)
- Revenue growth rate (YoY and QoQ)
- Win rate and average deal size
- Pipeline coverage ratio
- Quota attainment percentage
- Customer acquisition cost
Sales Manager Dashboard (12-15 metrics):
- Team and individual quota attainment
- Pipeline value by stage
- Win rate by rep and segment
- Sales cycle length trends
- New opportunity creation
- Activity ratios and leading indicators
- Forecast vs. actual variance
Individual Rep Dashboard (8-12 metrics):
- Personal quota attainment (month, quarter, year)
- Pipeline value and coverage
- Recent wins and losses
- Upcoming close dates
- Activity completion (calls, meetings, demos)
- Personal conversion rates
Essential Dashboard Elements
Real-Time Data: Sales dashboards should update daily at minimum, ideally in real-time for fast-moving metrics like pipeline value and close dates.
Trend Visualization: Show performance trends over 3-12 months to identify patterns, seasonality, and momentum. Single-point-in-time metrics lack context.
Comparative Analysis: Include multiple comparison points:
- Current period vs. same period last year
- Actual vs. target/quota
- Individual vs. team average
- Current quarter vs. previous quarters
Pipeline Visualization: Visual representation of deals by stage, showing movement, velocity, and potential risks. Funnel charts or Kanban-style boards work well.
Alert Systems: Automated notifications for critical thresholds:
- Rep falling below 70% of quota pace
- Pipeline coverage dropping below 3×
- Win rates declining more than 10%
- Sales cycle lengthening significantly
Sales KPI Dashboard Implementation
Whether using CRM-native dashboards, business intelligence tools, or spreadsheets, key implementation principles apply:
Integration with CRM: Pull data directly from Salesforce, HubSpot, Pipedrive, or your system of record. Manual data entry creates errors and delays.
Role-Based Access: Ensure reps see their own performance, managers see team performance, and executives see company-wide metrics. Avoid overwhelming users with irrelevant data.
Mobile Accessibility: Sales reps work remotely and travel frequently. Dashboards must function on mobile devices for anywhere access.
Actionability: Every metric on the dashboard should drive a specific action or decision. If a KPI doesn’t change behavior, remove it.
Industry-Specific Sales KPI Examples
Deal Velocity: Rate at which deals move through the pipeline, measured in dollars per day. Combines deal size, win rate, and sales cycle length.
Proof of Concept (POC) Win Rate: Percentage of POCs that convert to closed deals, critical for technical or complex sales.
Multi-Threading Score: Number of stakeholders engaged per deal, as enterprise sales require multiple champion relationships.
Conversion Rate: Percentage of website visitors or store visitors who make purchases.
Average Order Value (AOV): Mean transaction size, optimized through bundling, upselling, and cross-selling.
Customer Repurchase Rate: Percentage of customers making repeat purchases, indicating satisfaction and loyalty.
Cart Abandonment Rate: Percentage of initiated purchases not completed, revealing checkout friction points.
Implementation Strategy for Sales KPIs
Phase 1: Foundation Building
Align with Revenue Goals: Start by clarifying revenue targets, then work backward to determine required pipeline, win rates, and activities. Your KPI sales framework must directly support revenue objectives.
Audit Current Tracking: Assess what’s currently measured, data quality, and whether existing metrics actually correlate with sales success. Identify gaps between what you track and what matters.
Select Core KPIs: Start with 8-12 essential metrics rather than tracking everything. Prioritize leading indicators (pipeline, activities) and lagging indicators (revenue, win rate) that provide complete visibility.
Phase 2: Data and Systems
CRM Configuration: Ensure your CRM accurately captures the data needed for KPI calculations. Common gaps include:
- Incomplete opportunity stages or unclear stage definitions
- Missing close dates or inconsistent date updates
- Inaccurate deal amounts or probability percentages
- Unclear win/loss reasons
Reporting Infrastructure: Build or configure your sales KPI dashboard using CRM-native tools, business intelligence platforms, or spreadsheets. Automate data pulls to eliminate manual reporting work.
Calculation Validation: Test KPI calculations against known results. Verify formulas, data sources, and update frequencies before rolling out widely.
Phase 3: Adoption and Coaching
Sales Team Training: Educate reps on what each KPI means, why it matters, and how their actions influence it. Reps can’t improve metrics they don’t understand.
Regular Review Cadence: Establish consistent review schedules:
- Daily: Quick pipeline reviews and activity tracking
- Weekly: Individual rep performance and coaching sessions
- Monthly: Comprehensive team performance and trend analysis
- Quarterly: Strategic review and target adjustments
Coaching with Data: Use KPI insights to provide specific, actionable coaching. Rather than “make more calls,” coach to “your calls-to-meetings ratio is 8% versus team average of 15%—let’s improve your qualifying questions and value proposition.”
Common Sales KPI Pitfalls
Vanity Metrics Disguised as KPIs: Tracking impressive-looking numbers that don’t correlate with revenue. 500 cold calls mean nothing if none convert to opportunities.
Lack of Context: A 25% win rate could be excellent or terrible depending on industry, deal size, and sales cycle. Always include benchmarks and targets alongside actual performance.
Ignoring Leading Indicators: Revenue is a lagging indicator—by the time it’s low, the problem started months ago. Monitor leading indicators like pipeline creation and early-stage conversion rates.
One-Size-Fits-All Metrics: Enterprise sales reps and SMB inside sales reps require different KPIs. Segment your metrics by role, segment, and sales motion.
Gaming Behaviors: When reps are measured and compensated on specific metrics, they optimize for those metrics—sometimes in counterproductive ways. Balance multiple KPIs to prevent gaming.
Static Targets: Market conditions, product offerings, and competitive dynamics change. Review and adjust targets quarterly to maintain relevance.
Technology Solutions for Sales KPI Tracking
CRM Platforms
Modern CRMs like Salesforce, HubSpot, and Microsoft Dynamics include robust reporting and dashboard capabilities:
- Pre-built sales KPI reports and dashboards
- Customizable metrics and visualizations
- Real-time data updates
- Mobile access for remote teams
Sales Analytics Platforms
Specialized solutions like Clari, Gong, or InsightSquared provide advanced sales analytics:
- AI-powered forecasting and pipeline analysis
- Conversation intelligence and deal risk assessment
- Automated activity tracking and logging
- Predictive analytics for deal outcomes
Business Intelligence Tools
Platforms like Tableau, Power BI, or Looker enable sophisticated sales analytics:
- Multi-source data integration (CRM, marketing, finance)
- Advanced visualization and dashboard customization
- Self-service analytics for sales managers
- Automated report distribution
Measuring Sales Team ROI
Connect your sales KPI performance to business impact:
Revenue per Sales Dollar: For every dollar invested in sales (salaries, commissions, tools, travel), how much revenue is generated? Target 5:1 or higher for efficient sales organizations.
Customer Acquisition Cost (CAC) Trends: Track whether CAC increases or decreases over time. Improving sales efficiency should reduce CAC while maintaining or improving customer quality.
Sales Capacity Model: Calculate total achievable revenue based on rep count, ramp times, quota per rep, and expected attainment rates. Identifies when to hire and expected ROI of new reps.
Conclusion
Effective sales KPI implementation transforms sales organizations from activity-focused teams to results-driven revenue engines. By selecting the right metrics, building reliable measurement systems through proper sales KPI format, and consistently coaching based on data insights, sales leaders can achieve predictable revenue growth while continuously improving performance.
Success requires starting with KPIs clearly aligned with revenue goals, ensuring accurate data capture in your CRM, and building a sales KPI dashboard that drives daily decisions and behaviors. Whether tracking sample sales KPI metrics for individual reps or strategic metrics for executive leadership, the right framework makes sales performance transparent and optimizable.
Understanding what does KPI stand for in sales—Key Performance Indicators—reminds us to focus on the vital few metrics that truly drive outcomes. Track what matters, act on insights, and continuously refine your approach based on results.
Ready to implement comprehensive KPI tracking across your entire organization? Learn about essential business metrics and measurement frameworks in our complete guide to Key Performance Indicators.