Picture a manufacturing plant running at what management believes is “full capacity.” Production lines hum constantly, workers stay busy, and orders ship daily. Yet, profitability remains flat and customer complaints about delivery times are increasing. The plant manager insists everything is fine because “we’re always working hard.”
This was the reality for multiple companies before implementing proper operational KPI tracking. Once they started measuring key metrics, the truth emerged: their Overall Equipment Effectiveness was only 52% (world-class is 85%+), 18% of production time was lost to unplanned downtime, and their on-time delivery rate was just 73%. Within one year of implementing comprehensive operations KPI measurement, they increased equipment effectiveness to 78%, reduced downtime to 6%, and achieved 94% on-time delivery. The financial impact? Operating costs decreased by 22% while production capacity increased by 31%, all without adding new equipment or significant headcount.
This comprehensive guide explores essential KPI examples for operations, provides actionable frameworks for measurement across different operational contexts, and shows you how to build a data-driven operations function that drives measurable business results.
What Are Operations KPIs?
Operations KPI metrics are quantifiable measurements that evaluate how effectively your organization executes its core operational processes. Unlike strategic KPIs that focus on long-term goals, operational KPIs measure day-to-day performance of the systems and processes that deliver products or services to customers.
These metrics serve critical functions across the organization:
- Identify inefficiencies and bottlenecks in real-time
- Enable data-driven decision making for process improvements
- Provide early warning signals for potential issues
- Align operational activities with strategic business objectives
- Demonstrate operational excellence to stakeholders
Operations KPIs vs. Metrics: Understanding the Distinction
While the terms are often used interchangeably, there’s an important difference between operational metrics and operational KPIs. Metrics are simply measurements, any data point you track in your operations, such as “units produced today” or “number of customer calls handled.” They’re raw numbers that describe what’s happening. An operational KPI, however, is a key metric that directly ties to strategic business objectives and requires action when it falls outside acceptable ranges. Not every metric deserves to be a KPI.
Think of it this way: your operations might track 50 different metrics, but only 8-10 should be designated as KPIs, the critical few that truly indicate whether your operations are succeeding or failing. For example, you might measure “total machine hours run” as a metric, but “Overall Equipment Effectiveness (OEE)” becomes a KPI because it directly impacts profitability and competitive positioning. The key is selectivity: KPIs are the metrics that matter most to achieving your operational goals, while metrics provide the supporting data that helps you understand and improve those KPIs.
Understanding Operational KPIs vs. Strategic KPIs
Before diving into specific metrics, it’s important to understand what makes an operational KPI distinct. An example of an operational KPI would be “daily production output per machine” versus a strategic KPI like “market share growth.” Operational KPIs are:
Tactical and Immediate: They measure activities and outcomes that occur daily, weekly, or monthly rather than annually.
Process-Focused: They evaluate specific operational processes rather than broad business outcomes.
Actionable at Ground Level: Front-line managers and team members can directly influence these metrics through their daily actions.
Leading Indicators: Many operational KPIs predict future business performance, enabling proactive intervention.
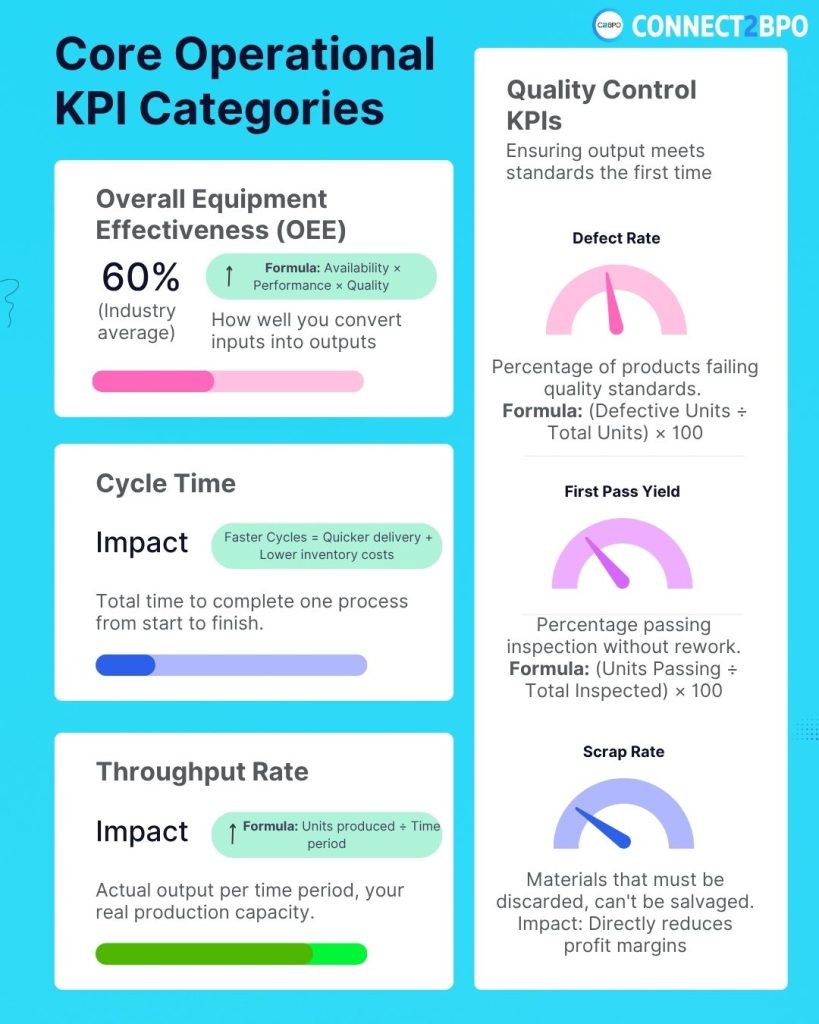
Core Operational KPI Categories
- Production Efficiency Metrics
Overall Equipment Effectiveness (OEE) Perhaps the most comprehensive manufacturing operational KPI, OEE measures how effectively production equipment operates relative to its full potential.
Calculation: Availability × Performance × Quality
- Availability: (Operating Time / Planned Production Time) × 100
- Performance: (Actual Output / Theoretical Maximum Output) × 100
- Quality: (Good Units / Total Units Produced) × 100
World-Class Target: 85% or higher Typical Industry Average: 60%
Cycle Time The total time required to complete one full operational cycle, from start to finish of a process.
Why It Matters: Shorter cycle times mean faster customer delivery, lower work-in-progress inventory, and greater responsiveness to demand changes.
Throughput Rate Measures the actual output quantity per unit of time, revealing true productive capacity.
Calculation: Total units produced / Time period Application: Compare actual throughput against theoretical capacity to identify constraint points.
- Quality Control KPIs
Defect Rate This fundamental quality metric tracks the percentage of products or outputs that fail to meet quality standards.
Calculation: (Defective Units / Total Units Produced) × 100 Best Practice: Track defects by type and location to identify root causes systematically.
First Pass Yield Measures what percentage of products pass quality inspection without requiring rework.
Calculation: (Units Passing First Inspection / Total Units Inspected) × 100 Target Range: 95%+ for most manufacturing operations
Scrap Rate The percentage of materials or products that cannot be salvaged and must be discarded.
Financial Impact: Directly affects material costs and profit margins Root Cause Analysis: High scrap rates typically indicate process control issues or design problems
- Resource Utilization Metrics
Labor Productivity Measures output generated per unit of labor input, crucial for understanding workforce efficiency.
Calculation: Total Output / Total Labor Hours Variations: Can be measured by individual, team, shift, or facility
Capacity Utilization Rate Shows what percentage of available production capacity is actually being used.
Calculation: (Actual Output / Maximum Possible Output) × 100 Interpretation: Too low indicates waste; too high may signal quality risks and inability to handle demand spikes
Inventory Turnover Measures how quickly inventory moves through operations, indicating efficiency of inventory management.
Calculation: Cost of Goods Sold / Average Inventory Value Industry Variance: Ranges from 2-3 times annually for heavy equipment to 20+ for perishable goods
Operational KPI Examples Across Industries
- Manufacturing Operations
Production Volume Variance Compares actual production output to planned targets, revealing scheduling accuracy and capacity issues.
Calculation: ((Actual Production – Planned Production) / Planned Production) × 100
Machine Downtime Percentage Critical for understanding availability losses and maintenance effectiveness.
Components:
- Planned downtime (scheduled maintenance)
- Unplanned downtime (breakdowns and failures)
- Changeover time (product transitions)
Order Fulfillment Cycle Time Measures the complete time from order receipt to product shipment.
Target Setting: Benchmark against competitors and customer expectations
- Warehouse and Distribution Operations
Order Picking Accuracy Essential KPI for operations in distribution centers, measuring error rates in order fulfillment.
Calculation: (Orders Picked Correctly / Total Orders Picked) × 100 Impact: Directly affects customer satisfaction and return processing costs
Warehouse Capacity Utilization Tracks how effectively available storage space is being used.
Calculation: (Space Used / Total Available Space) × 100 Optimization Range: 85-95% (too low wastes space; too high impedes operations)
Average Putaway Time Measures efficiency of receiving and storing incoming inventory.
Benchmark Development: Track by product type and storage location for optimization opportunities
- Service Operations
Service Delivery Time For service-based operations, measures the time required to complete service delivery from initiation to completion.
Applications: Professional services, maintenance operations, hospitality services
Resource Scheduling Efficiency Tracks how effectively staff and equipment are scheduled against actual demand.
Metrics Include:
- Schedule adherence rate
- Idle time percentage
- Overtime hours as percentage of total hours
Sales Operations KPI Framework
Sales operations KPI metrics focus on the operational efficiency of the sales process itself, distinct from sales performance outcomes.
- Pipeline Management Efficiency
Lead Response Time Measures how quickly sales operations teams respond to and process new leads.
Calculation: Time from lead receipt to first meaningful contact Industry Standard: Within 5 minutes for hot leads; within 24 hours for standard leads
Quote Generation Time Tracks operational efficiency in creating and delivering sales quotes.
Impact: Faster quote turnaround correlates directly with higher close rates
Sales Cycle Length While influenced by sales strategy, this metric reveals operational friction points in the sales process.
Analysis Approach: Break down by deal size, product type, and sales stage to identify bottlenecks
- CRM Data Quality Metrics
Data Completeness Rate Measures what percentage of required fields are populated in CRM records.
Calculation: (Complete Records / Total Records) × 100 Importance: Incomplete data hampers reporting, forecasting, and process automation
CRM Adoption Rate Tracks how consistently sales teams use CRM systems for activity logging and pipeline management.
Measurement: Daily active users / Total sales team members
Data Center Operations KPI
Data center operations KPI metrics are critical for organizations whose business depends on technology infrastructure reliability and performance.
- Availability and Reliability
System Uptime Percentage The most fundamental data center metric, measuring available time versus total time.
Calculation: (Total Time – Downtime) / Total Time × 100 Industry Standards:
- 99.9% (“Three Nines”): 8.76 hours downtime annually
- 99.99% (“Four Nines”): 52.56 minutes downtime annually
- 99.999% (“Five Nines”): 5.26 minutes downtime annually
Mean Time Between Failures (MTBF) Predicts reliability by measuring average time between system failures.
Calculation: Total Operating Time / Number of Failures Application: Guide preventive maintenance schedules and equipment replacement decisions
Mean Time To Repair (MTTR) Measures operational efficiency in responding to and resolving incidents.
Calculation: Total Repair Time / Number of Repairs Optimization: Lower MTTR through better documentation, training, and spare parts availability
- Efficiency and Cost Metrics
Power Usage Effectiveness (PUE) Industry-standard metric for data center energy efficiency.
Calculation: Total Facility Power / IT Equipment Power Interpretation:
- PUE of 2.0: Half the power goes to IT equipment, half to cooling/overhead
- PUE of 1.5: 67% efficiency (good)
- PUE of 1.2: 83% efficiency (excellent)
Server Utilization Rate Measures how effectively server capacity is being used.
Calculation: (Active Server Capacity / Total Server Capacity) × 100 Optimization Opportunity: Many data centers run at only 12-18% utilization, representing significant waste
Cost Per Rack Unit Enables comparison of data center operational efficiency across facilities.
Components: Power, cooling, facilities, maintenance, staff allocated per rack unit
Performance Metrics
Network Throughput Measures actual data transfer rates versus theoretical capacity.
Key Indicators:
- Average throughput during peak hours
- Throughput consistency (variance)
- Bandwidth utilization percentage
Storage Utilization and Performance Tracks both capacity usage and I/O performance.
Metrics:
- Storage capacity utilization percentage
- IOPS (Input/Output Operations Per Second)
- Average latency for read/write operations
Advanced Operational KPI Examples
Process Capability Metrics
Process Capability Index (Cpk) Statistical measure of how well a process meets specifications.
Interpretation:
- Cpk < 1.0: Process not capable
- Cpk = 1.33: Process capable (industry minimum)
- Cpk > 1.67: Process highly capable
Sigma Level Measures process consistency and defect rate using Six Sigma methodology.
- 3 Sigma: 66,807 defects per million
- 4 Sigma: 6,210 defects per million
- 5 Sigma: 233 defects per million
- 6 Sigma: 3.4 defects per million
Supply Chain Operations
Perfect Order Rate Comprehensive metric measuring what percentage of orders are delivered complete, on-time, damage-free, with correct documentation.
Calculation: (Perfect Orders / Total Orders) × 100 World-Class Target: 95% or higher
Supply Chain Cycle Time Total time from raw material procurement to finished product delivery.
Optimization Focus: Reducing cycle time improves cash flow and responsiveness
Cash-to-Cash Cycle Time Measures how long capital is tied up in operations.
Calculation: Days Inventory Outstanding + Days Sales Outstanding – Days Payable Outstanding Goal: Minimize this metric to improve working capital efficiency
Implementation Strategy for Operational KPIs
Phase 1: Assessment and Planning
Current State Analysis
- Document existing measurement systems and metrics
- Identify data collection gaps and reliability issues
- Interview operational leaders about decision-making needs
- Review strategic objectives requiring operational support
Metric Selection Choosing the right operational KPI examples for your organization requires balancing comprehensiveness with manageability.
Selection Criteria:
- Alignment with strategic objectives
- Actionability (can be influenced by operations team)
- Measurability (data available or obtainable)
- Relevance to decision making
Phase 2: Infrastructure Development
Data Collection Systems Implement or enhance systems for capturing operational data:
- IoT sensors and connected equipment
- Manufacturing execution systems (MES)
- Warehouse management systems (WMS)
- Enterprise resource planning (ERP) integration
Standardization and Documentation Create clear definitions and calculation methodologies for each KPI operations metric to ensure consistency:
- Metric definition and business rationale
- Calculation formula and data sources
- Update frequency and responsible party
- Target ranges and acceptable variance
Phase 3: Launch and Adoption
Training and Communication Ensure all stakeholders understand how to interpret and act on operational metrics:
- Manager training on dashboard usage and interpretation
- Team member education on how their actions impact KPIs
- Clear escalation procedures for out-of-range metrics
Quick Wins Identify opportunities where operations KPI measurement can quickly demonstrate value and build momentum for broader adoption.
Common Pitfalls in Operational KPI Implementation
Measuring Too Many Metrics Organizations often make the mistake of tracking dozens of metrics, causing analysis paralysis and diluting focus. Start with 5-10 critical KPIs and expand thoughtfully.
Ignoring Leading Indicators Focusing exclusively on lagging indicators (outcomes already achieved) prevents proactive management. Balance lagging metrics with leading indicators that predict future performance.
Gaming the System When compensation or recognition ties too directly to specific metrics, people may optimize for the metric rather than actual performance improvement. This is known as Goodhart’s Law.
Example: Measuring call center agents solely on call duration leads to rushed calls and poor customer service, even if the speed metric improves.
Lack of Context Raw numbers without context provide limited value. Always provide:
- Historical trends
- Targets and acceptable ranges
- Peer or benchmark comparisons
- Explanatory factors affecting performance
Static Metrics Operational needs evolve as processes improve and business conditions change. Review and refine your operational KPI suite quarterly to ensure continued relevance.
Industry Benchmarking and Best Practices
Establishing Meaningful Targets
Internal Benchmarking: Compare performance across facilities, lines, or teams to identify best practices and improvement opportunities.
Competitive Benchmarking: Understand where your operational performance stands relative to competitors.
World-Class Standards: Many operational KPI metrics have established world-class benchmarks:
- OEE: 85%+
- First Pass Yield: 99%+
- On-Time Delivery: 95%+
- Perfect Order Rate: 95%+
Industry-Specific Standards
Different industries have unique operational challenges requiring specialized metrics and targets:
Food and Beverage: Emphasize food safety, traceability, and regulatory compliance metrics Pharmaceuticals: Focus on validation, compliance, and batch documentation Automotive: Stress defect rates, just-in-time delivery, and supplier quality Electronics: Prioritize yield rates, component traceability, and test coverage
Conclusion
Effective operational KPI implementation transforms operations from reactive firefighting to proactive performance management. By selecting the right metrics, implementing robust measurement systems, and consistently acting on insights, operations teams can drive continuous improvement while demonstrating clear business value.
The key to success lies in starting with a focused set of metrics aligned with strategic objectives, building reliable data collection infrastructure, and fostering a culture where operational metrics drive daily decision making at all organizational levels.
Remember that the most sophisticated operations KPI system is only valuable if it enables better decisions and drives measurable improvements. Focus on actionable insights rather than impressive dashboards, ensure front-line teams understand how their actions impact metrics, and maintain relentless focus on continuous improvement.
Ready to implement comprehensive KPI tracking across your entire organization? Learn about essential business metrics and measurement frameworks in our complete guide to Key Performance Indicators.